
- Home
- Products
- Data Management
- Envirosoft CEMSuite
Envirosoft CEMSuite
CEMS data logging and reporting software
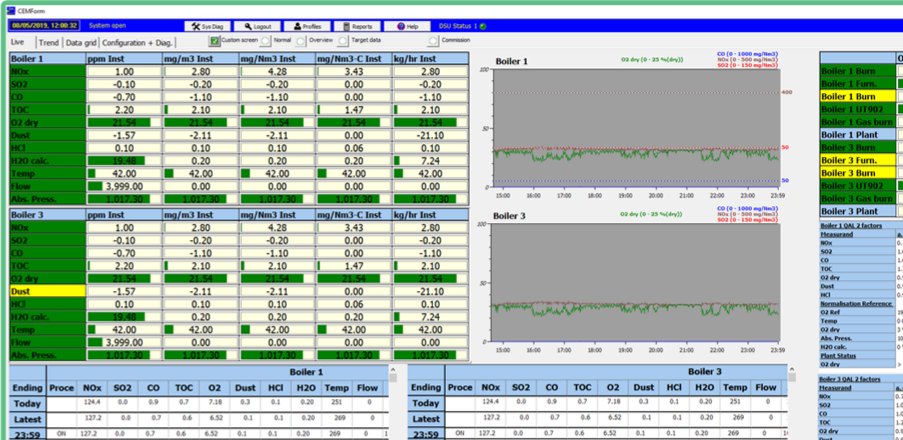
CEMSuite from Envirosoft is a data logging and reporting package for continuous emission monitoring systems (CEMS). It collects, stores and reports the data from your stack analysers, helping you show compliance with your licence and with IED, PPC and EN 14181 requirements. Envirosoft’s software holds MCERTS certification for environmental software.
Versions
- CEMSuite: the core package for CEMS data logging and reporting on smaller boilers and power generators.
- CEMSuite+: adds QAL3 assessment software (EN 14181) and the Environment Agency-designed reporting for waste incineration.
- CEMSuite Power: advanced reporting for sites under the Large Combustion Plant Directive.
Program features
- All programs have full MCERTS certification
- Real-time and historical data screens
- User-configurable alarms for multiple averages, with email and SMS alerts
- Calculated target levels to help you achieve compliance
- Advanced primary data storage facilities
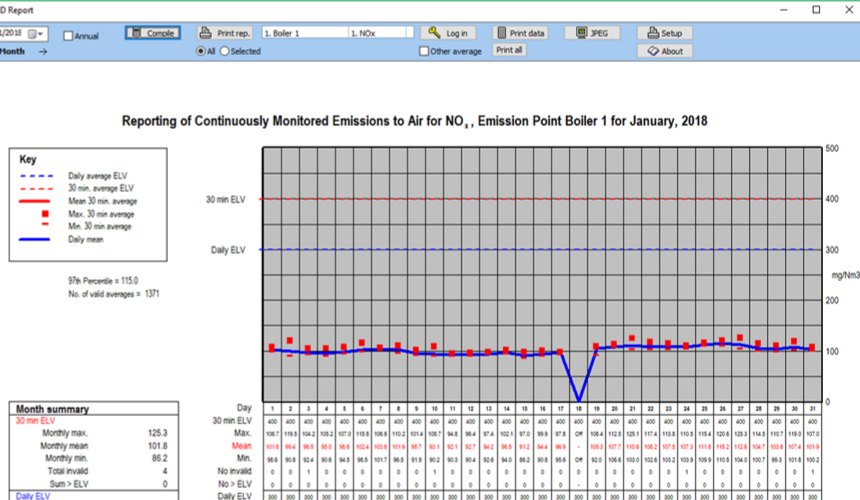
- Report generation and data output to Excel, CSV and HTML
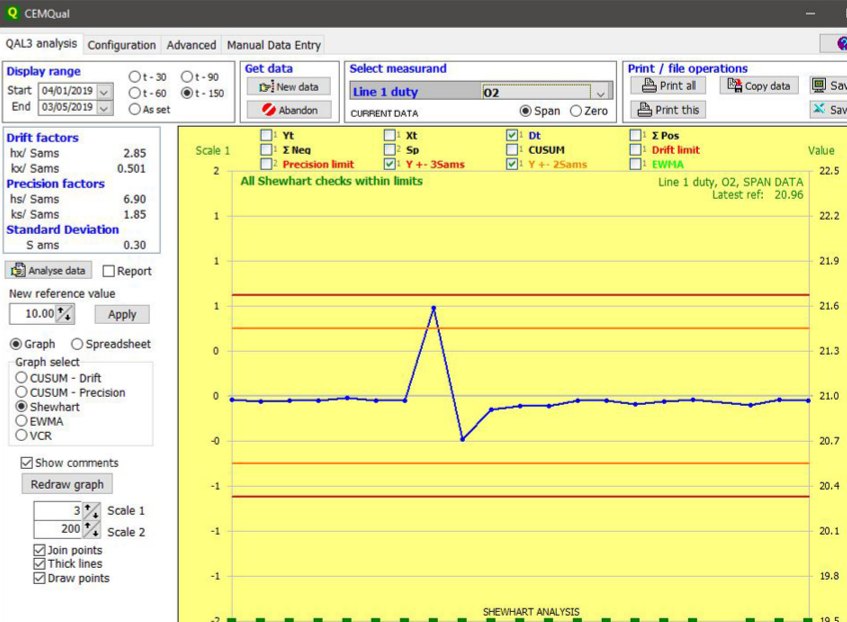
- QAL3 analysis with CUSUM (drift and precision), Shewhart and EWMA charts
- Valid Calibration Range (VCR) report
QAL3 (EN 14181)
- Automatic control chart generation
- CUSUM drift with pass/fail criteria and CUSUM precision
- Exponentially Weighted Moving Average (EWMA)
- Summary report for rapid assessment of compliance, with email facilities
- Display range selectable from 1 day to over 1 year
- Comment entry, storage and display, plus archiving for long-term record keeping
- Automatic calibration gas audit module
CEMPact complaints management
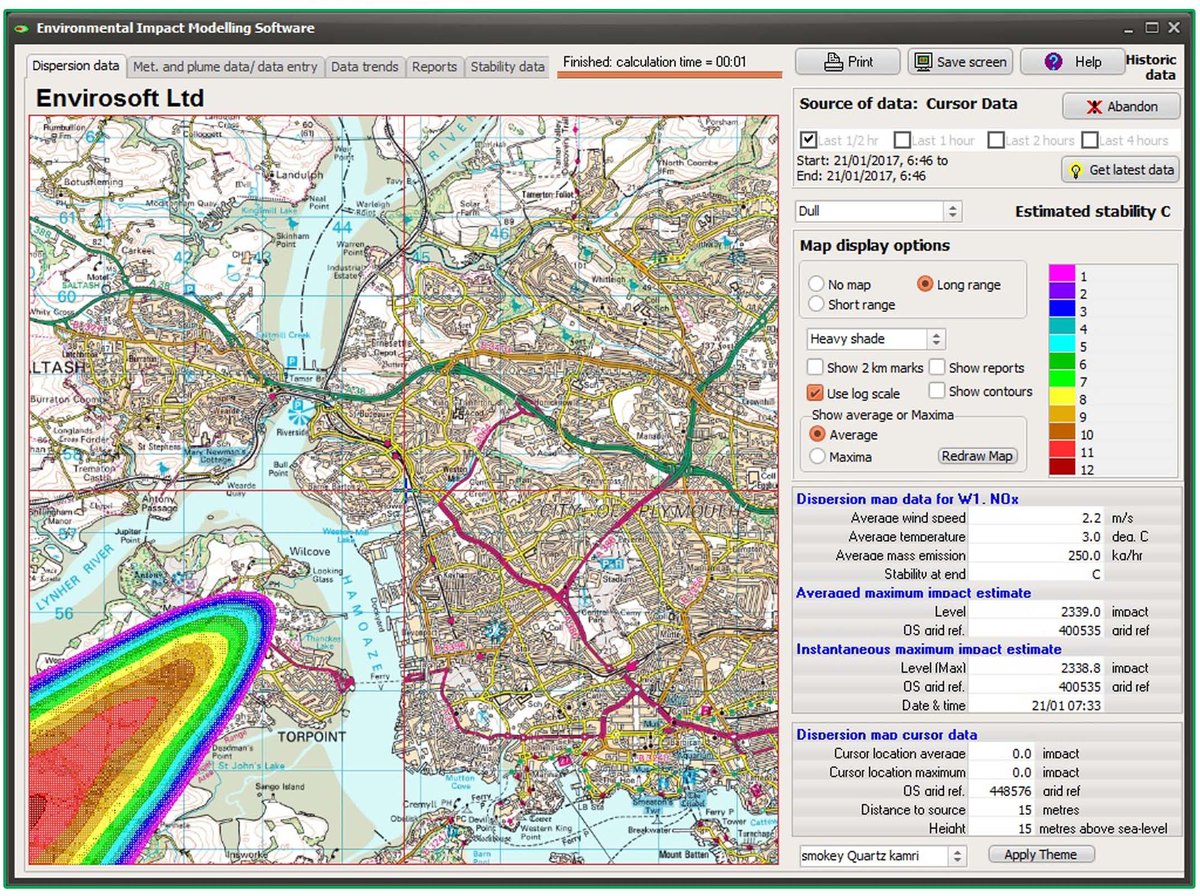
CEMPact works alongside CEMSuite. It combines CEMS and weather data to predict where emissions, dust or smells may be experienced at ground level near the site. The plume dispersion estimate is drawn on a map of the local area, either in real time or from historical data. Reports of environmental nuisance can be entered with their locations and plotted on the map alongside the dispersion at the reported time.
- Real-time and historical plume dispersion
- Complaint logging, with clusters and repeat complaints identified and checked against the weather data at the time
- Wind rose and statistical summary of wind direction and strength
- Plume trajectory for buoyant plumes, from exhaust gas temperature, volume and velocity
- Gaussian dispersion model following US EPA guidelines, adjusted for local terrain
- Results in µg/m³ or relative impact
| Data screens and reports | Real-time display of raw, normalised and averaged data; historical trends of all stored data; daily, weekly, monthly, quarterly, bi-annual and annual analysis; custom reports; QAL2 data entry and adjustment |
|---|---|
| Analyser interfaces | Gas, dust, flow and weather instruments from the major manufacturers over digital links, plus 4–20 mA and 0–10 V analogue inputs and volt-free contacts for measurement validity and plant information |
| Plant DCS interfaces | Modbus (RS232, RS485, Ethernet), Profibus DP, OPC, PI (SDK and OPC), analogue 4–20 mA and volt-free contact retransmission |
| Data storage | Data storage unit (DSU) holds the primary data for more than 10 years; up to 8 DSUs per system; up to 288 data points (12 pages of 24 measurands); update every 5–10 seconds; averaging from 1 minute to 1 year |
| Backup and redundancy | Replicated data access, logging and processing; configurable for backup or redundant analyser operation; dual fibre-optic redundancy |
0 products selected